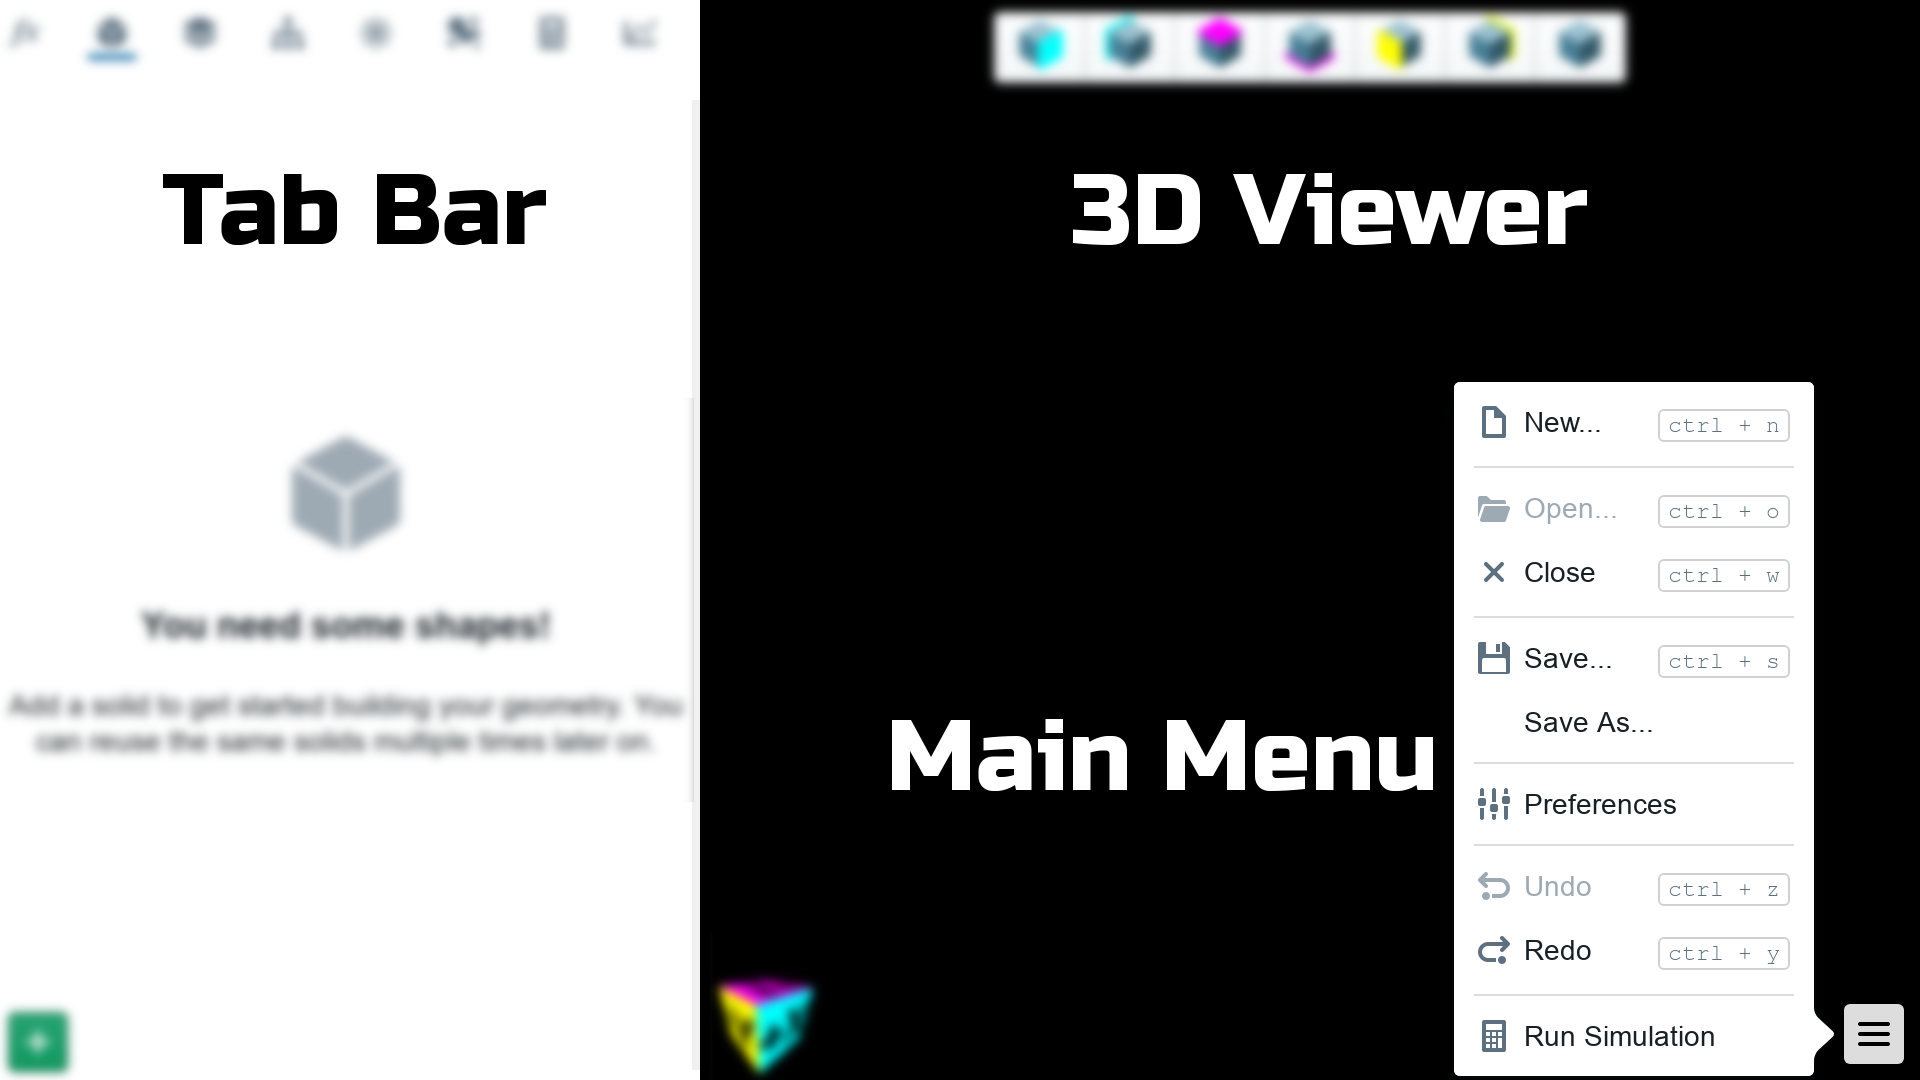
Window Layout
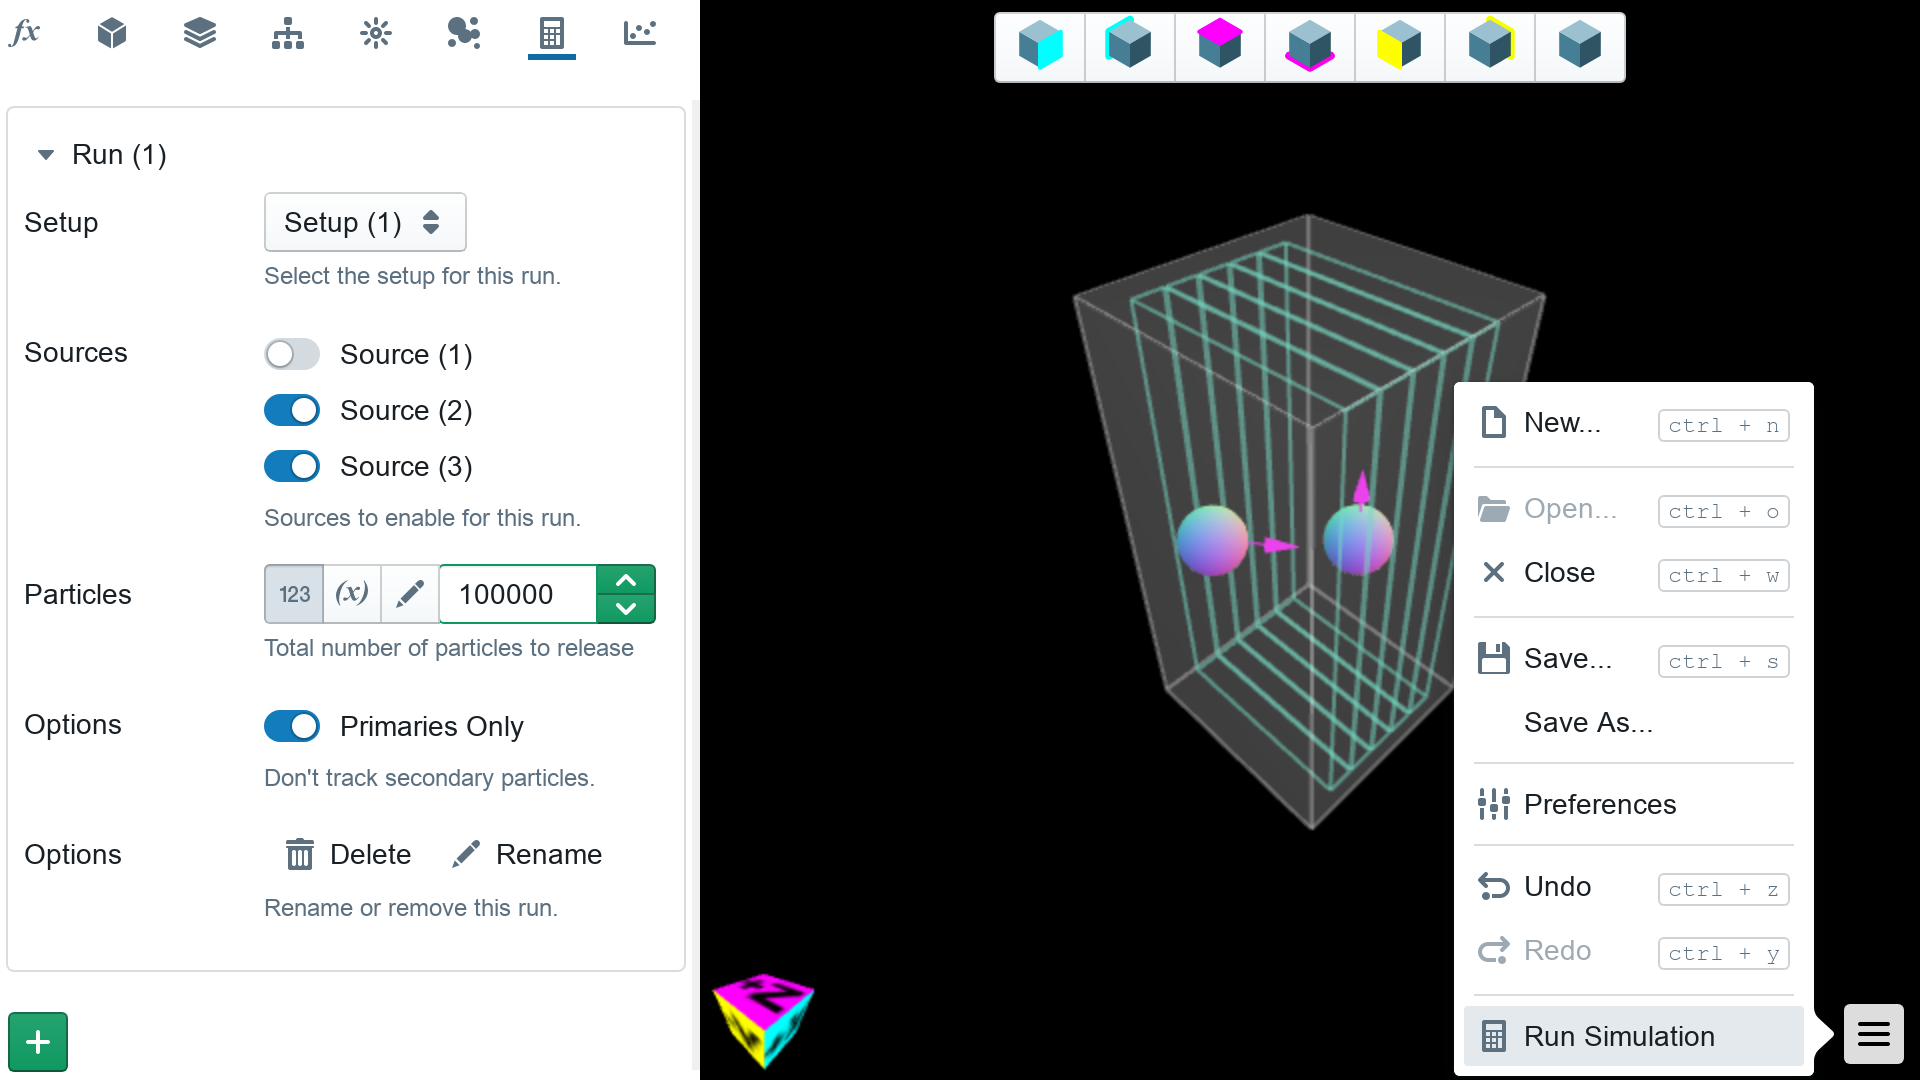
The Shielding Studio main window is divided into two main regions. The 3D viewer on the right, and the tab bar on the left. Click on the button icons at the top of the tab bar to change tabs. Click and drag in the 3D viewer to change your viewing position, and middle click drag to pan around. Scrolling your mouse wheel will zoom in and out.
In the bottom right hand corner of the window is the main menu button. Here you will find general program controls, such as opening files, save operations, and undo/redo actions.
Preferences
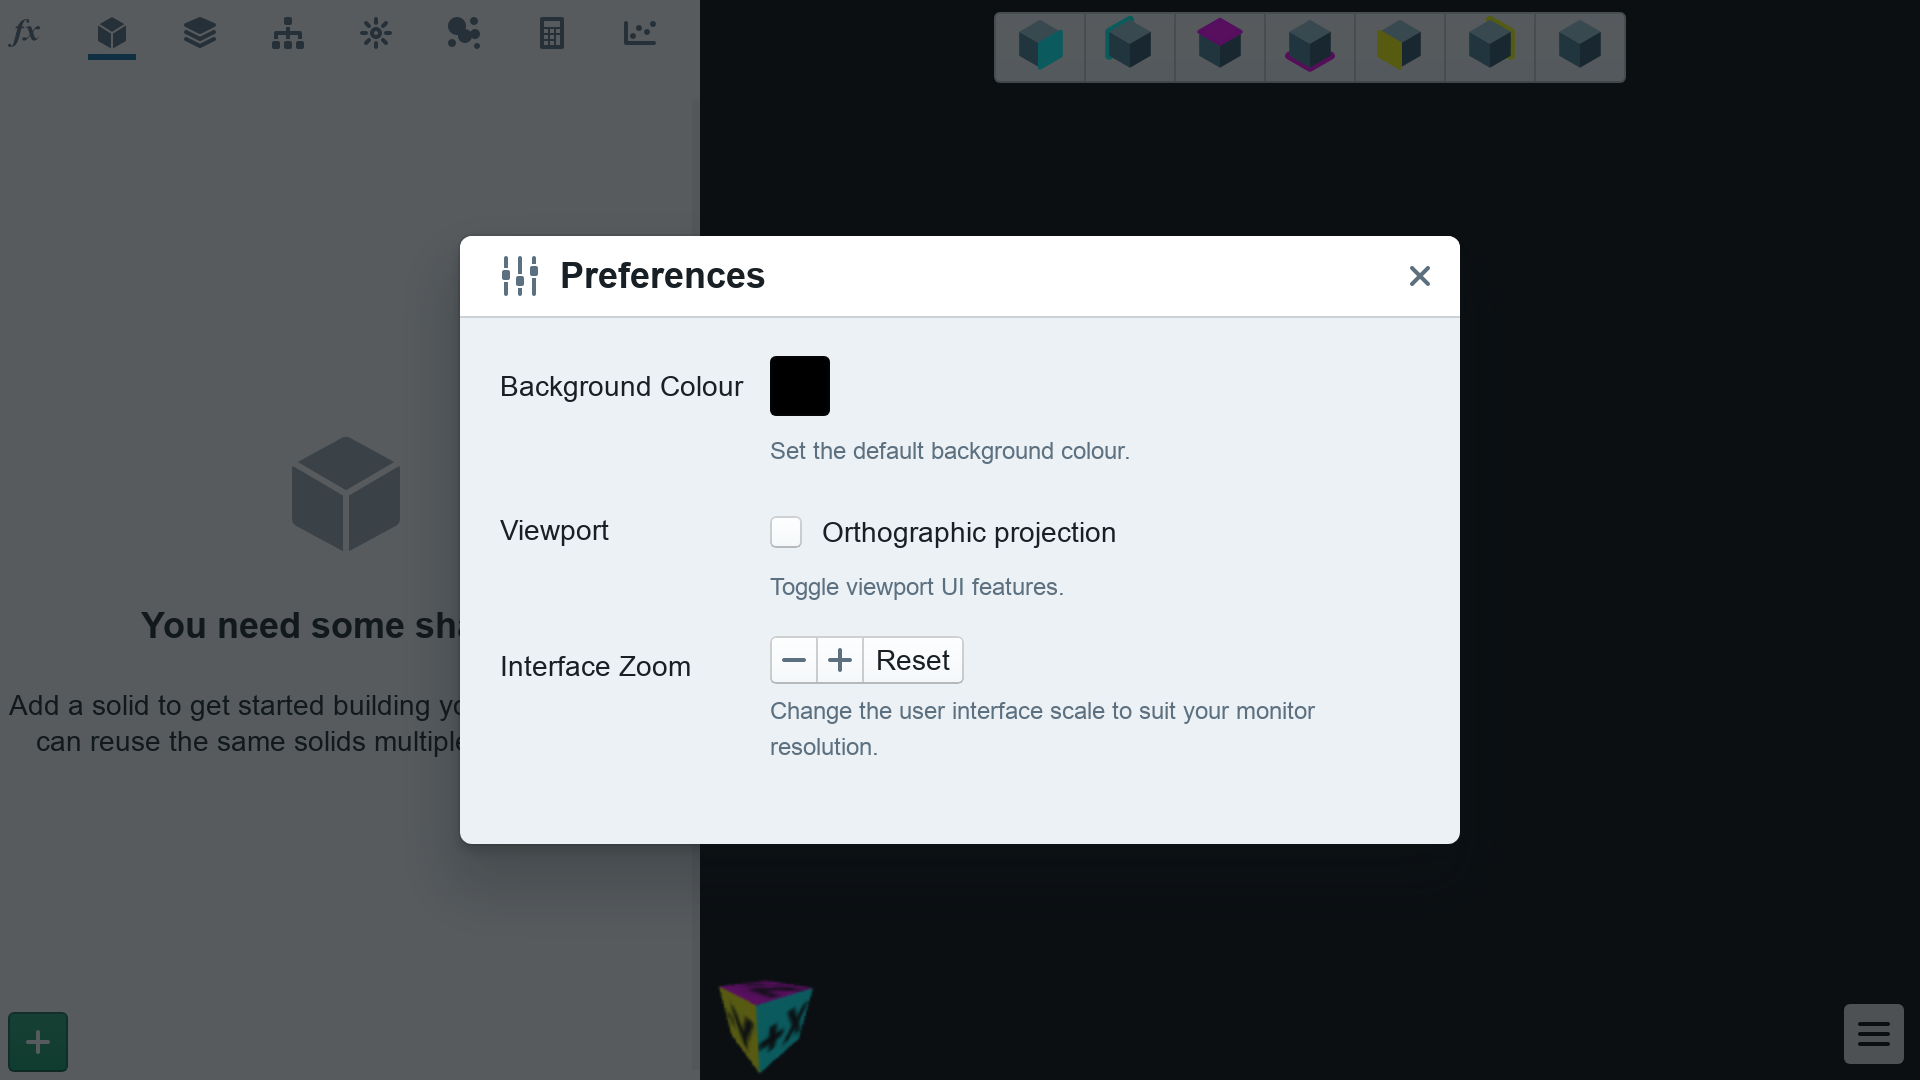
General program options can be set in the preferences window. Access this window via the main menu. Here you can control the size of the user interface controls (useful if you are using a high resolution or very large monitor), as well as the 3D viewport projection and background color.
Shapes
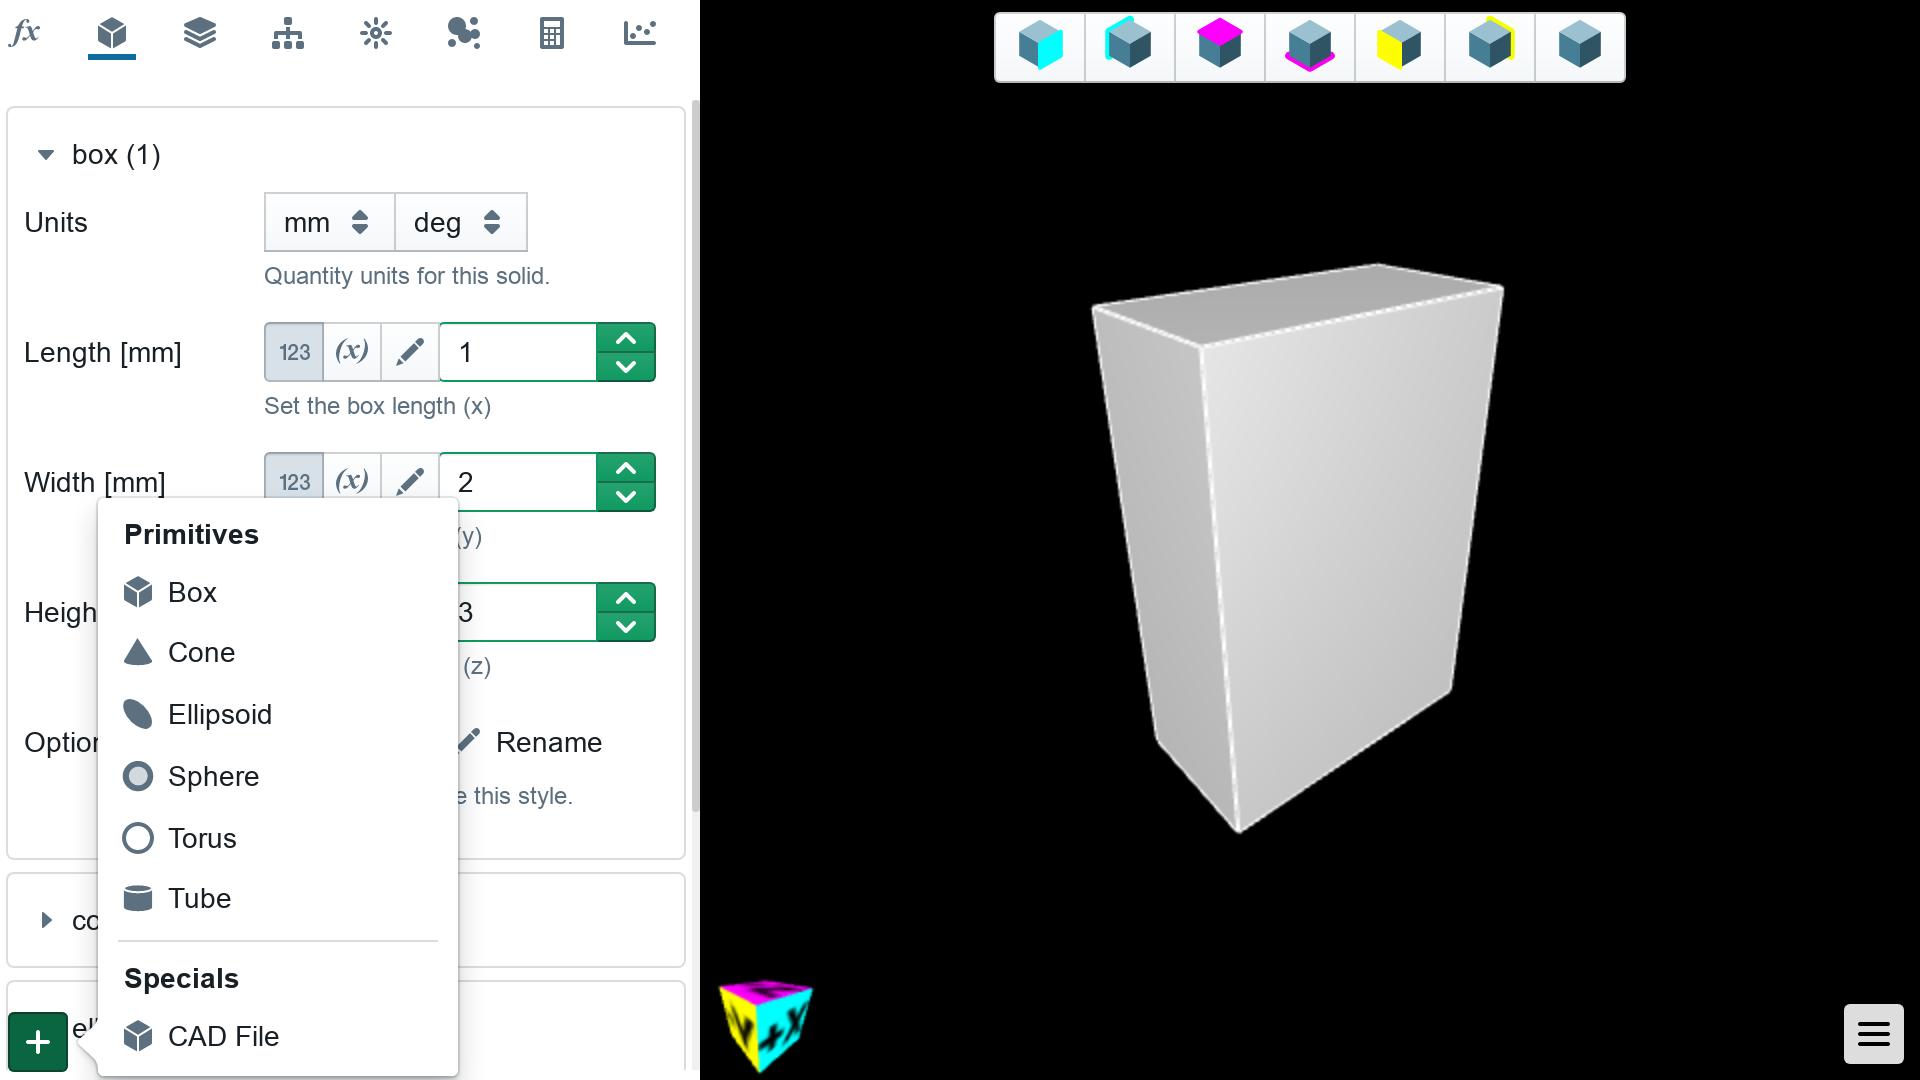
Shapes define the fundamental geometry elements in Shielding Studio. Simple shapes such as boxes, tubes and spheres can be added by clicking on the plus (+) icon in the bottom left corder of the Shapes tab. It is also possible to add shapes that are defined as triangle meshes in STL or PLY formatted files. You can export these sorts of files from most CAD packages, such as SolidWorks.
Volumes
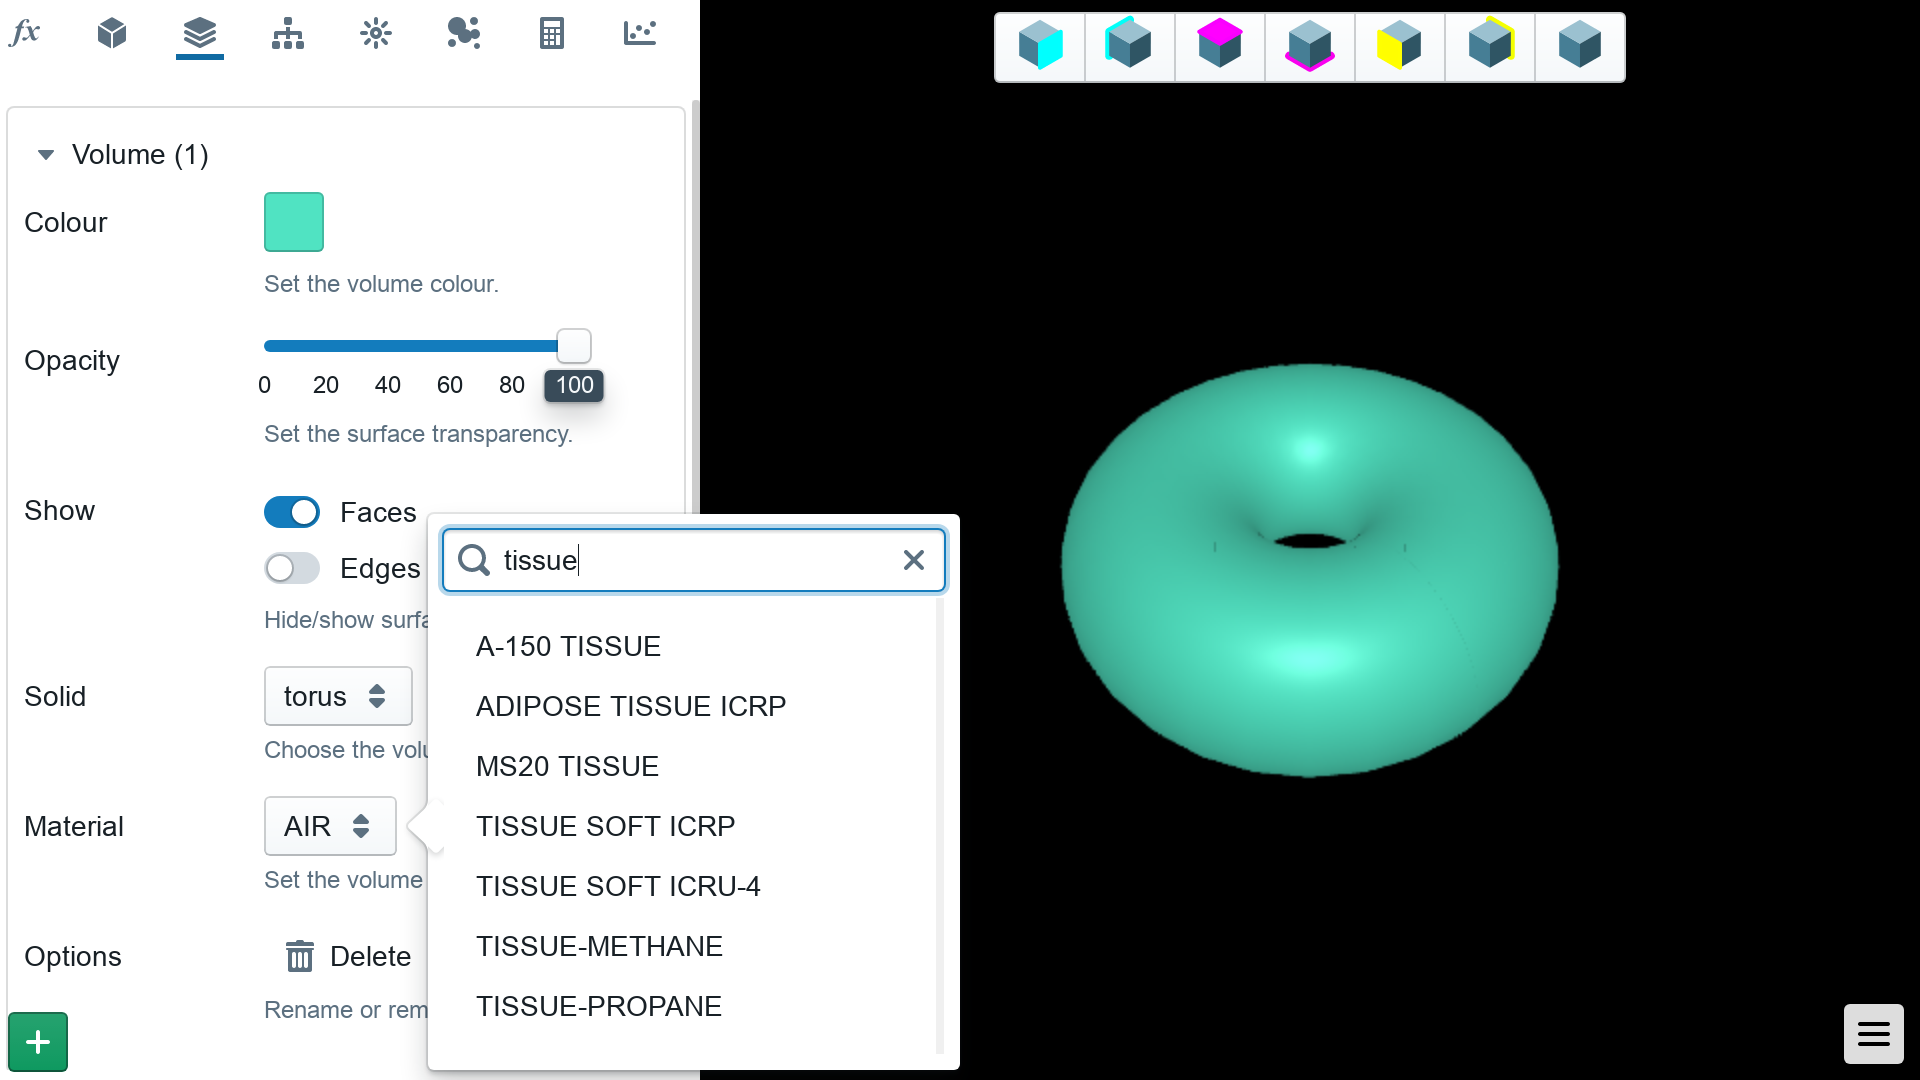
This is where we assign material proprieties and aesthetic attributes to shapes. You can reuse shapes multiple times in your simulation, each time with a different material, or colour if you desire.
Assemblies
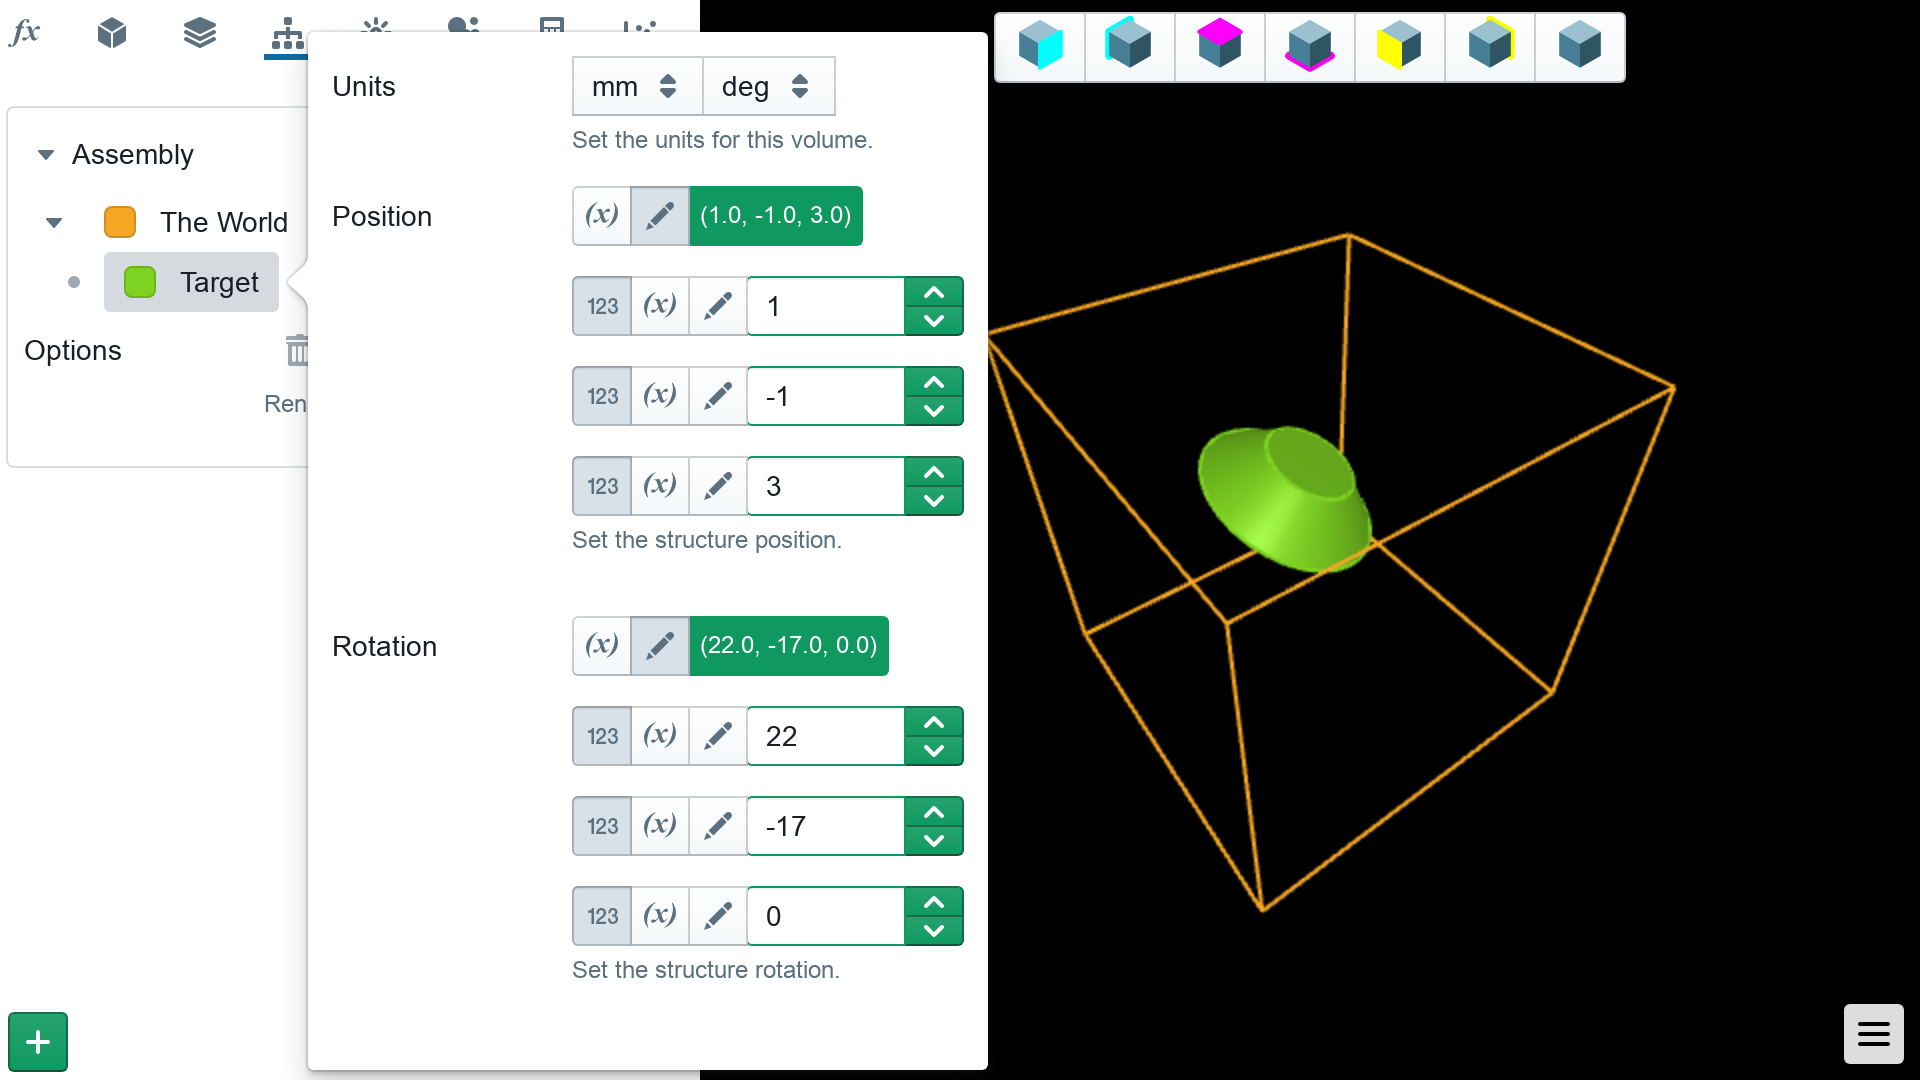
Your simulation geometry is an assembly of volumes. Here you specify if volumes are inside or outside of each other, as well as how they are positioned and rotated.
Sources
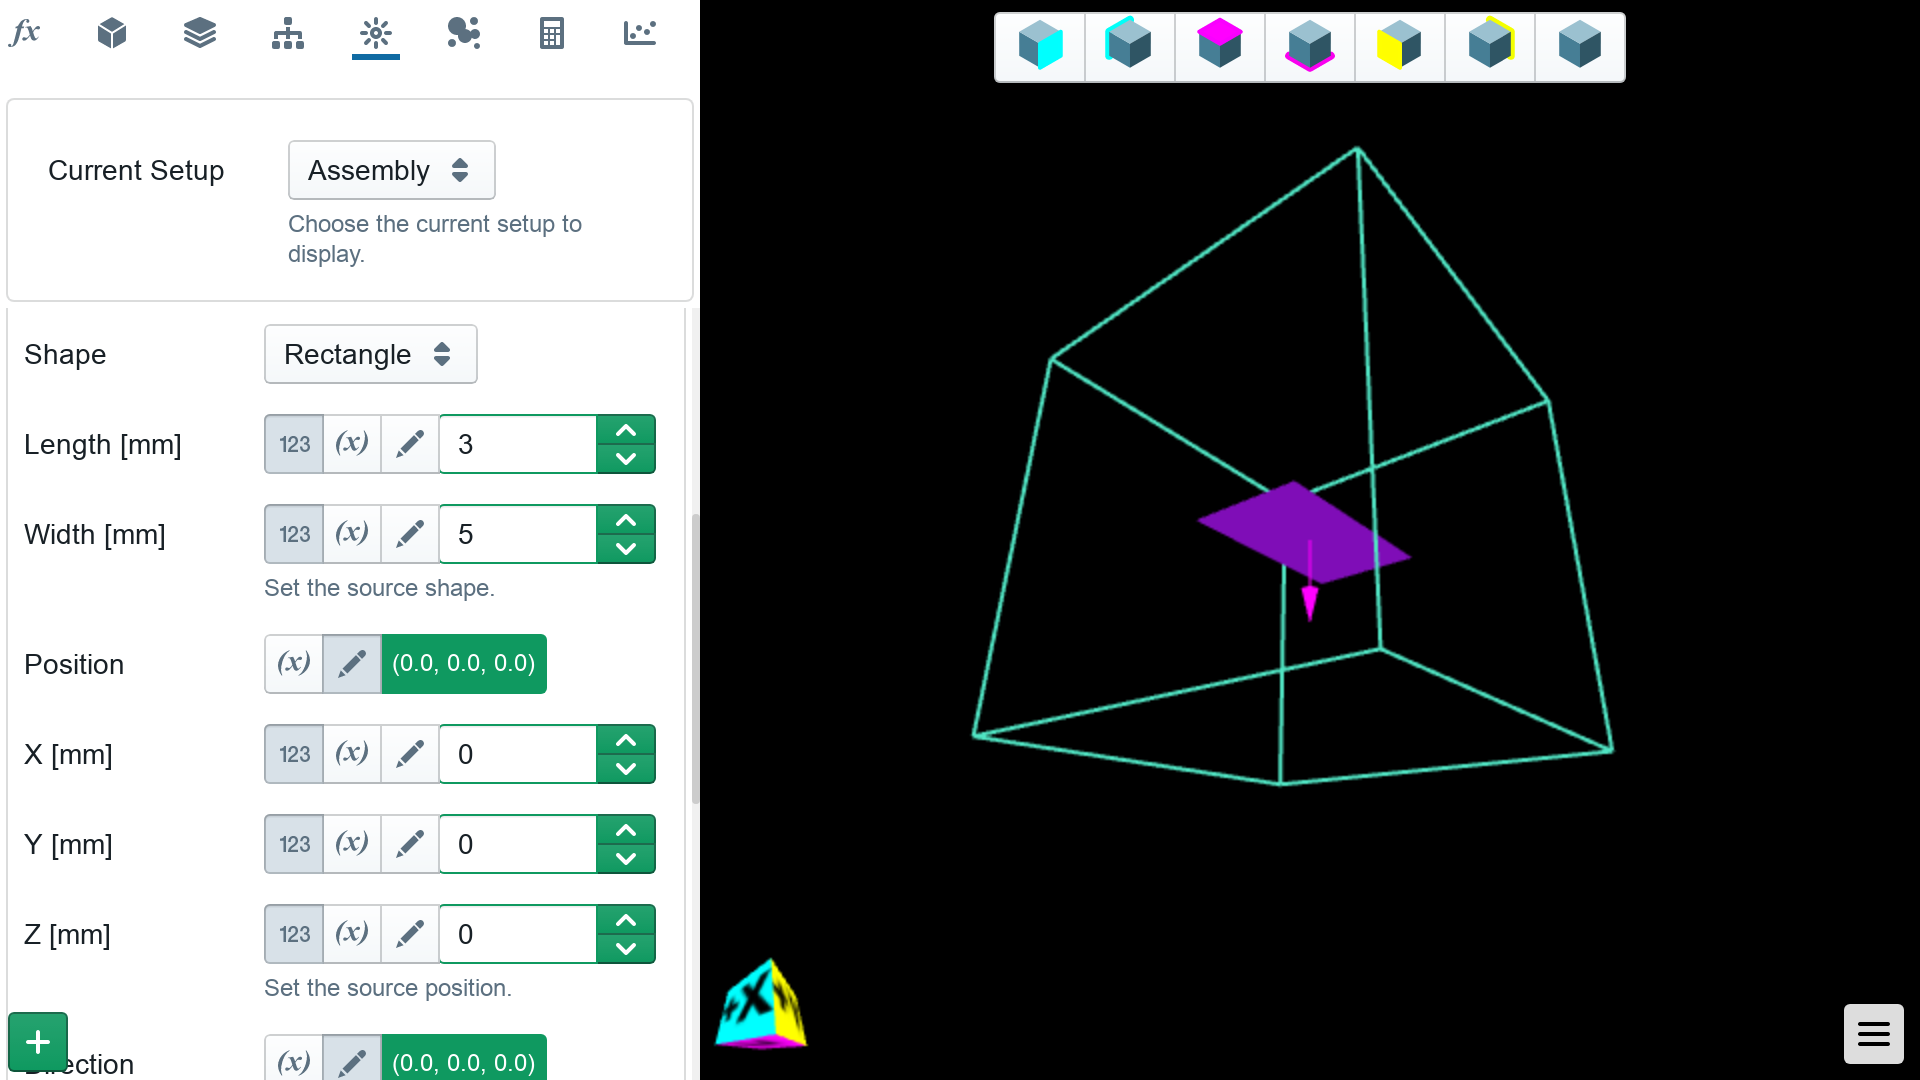
Sources are where particles originate in your simulation, and they go on to deposit radiation dose. You are able to specify a variety of source times, whether it be a particle source, or radioactive isotope. Various source shapes and positions are also possible.
Detectors
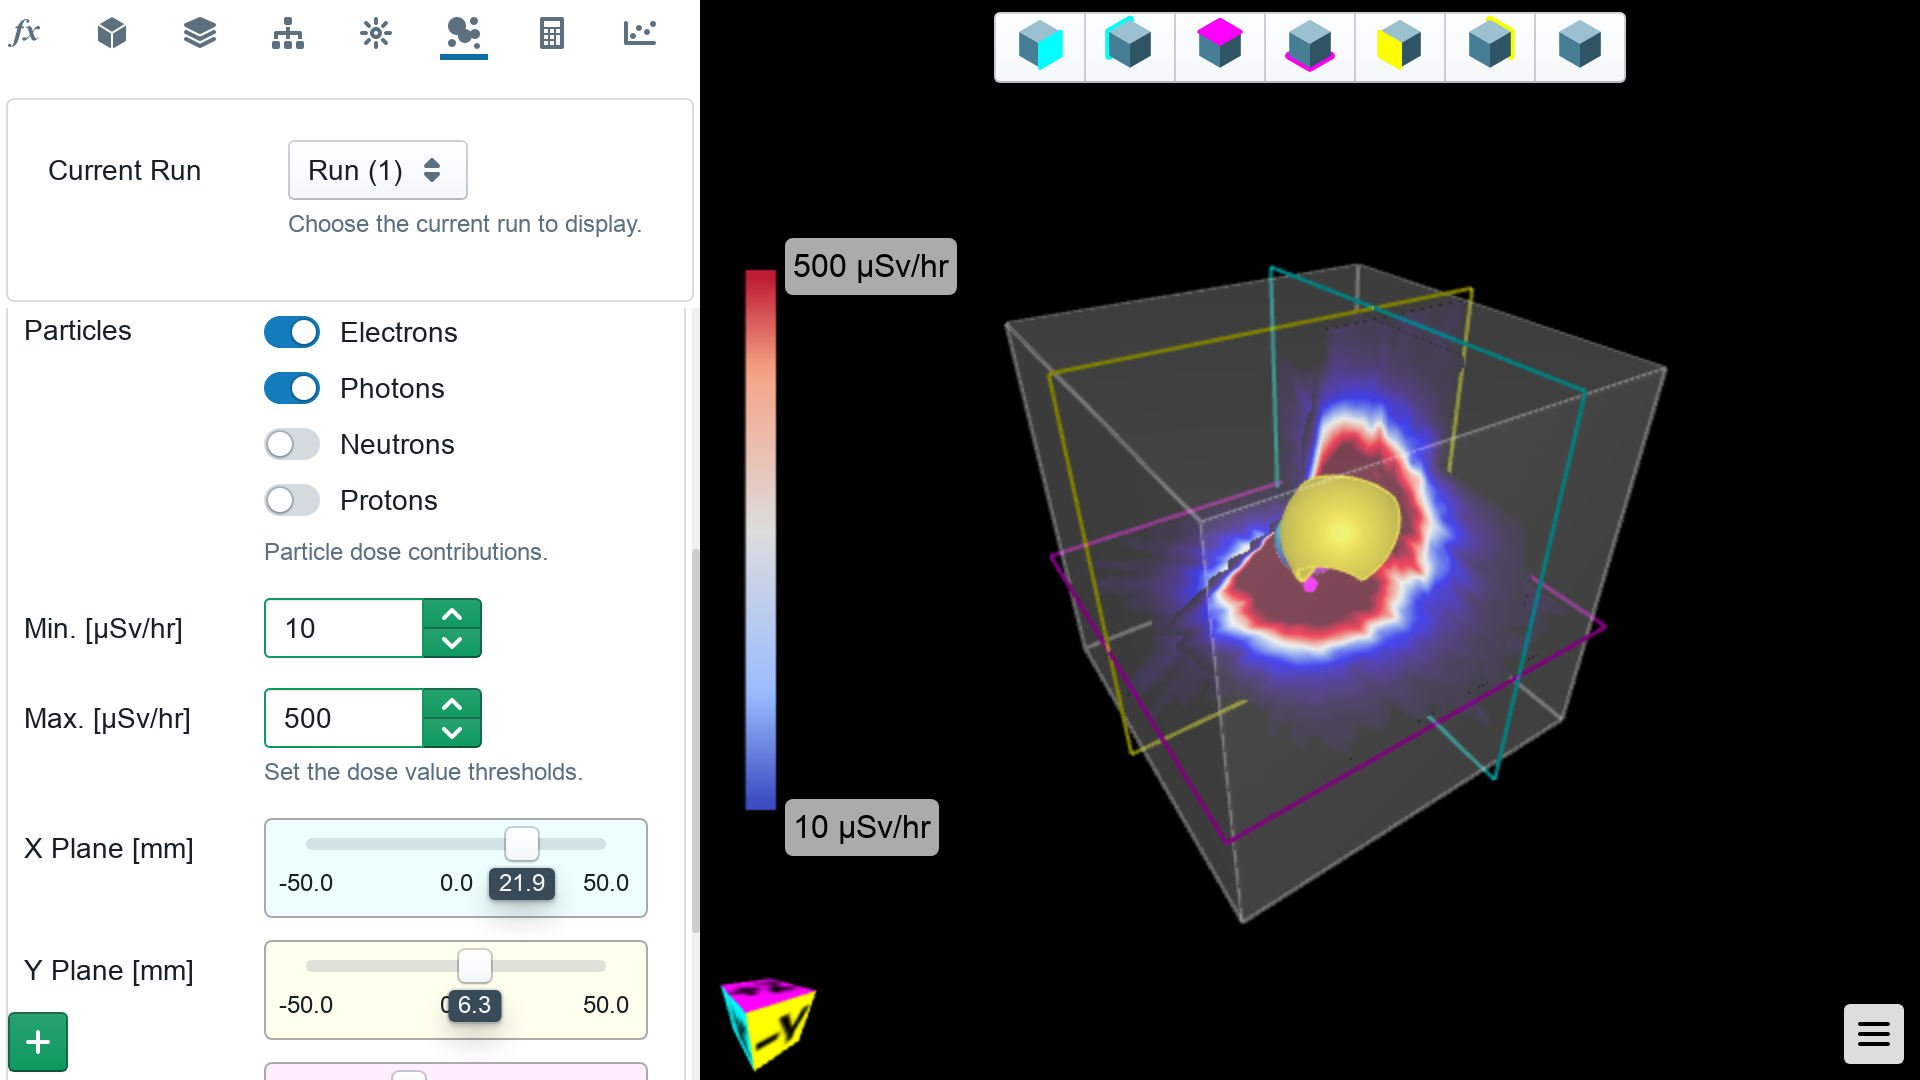
Dose is recorded in detectors. These are typically air-filled boxes. Radiation protection dose quantities are defined in air, so we reproduce that condition here. When dose has been accumulated in a detector, you can explore it in 3D on the detectors tab as well!
Runs
It is possible to setup multiple simulation runs in Shielding Studio, with different geometries or your various sources enabled or disabled. Here you can also control how long a simulation will run for.
Charts
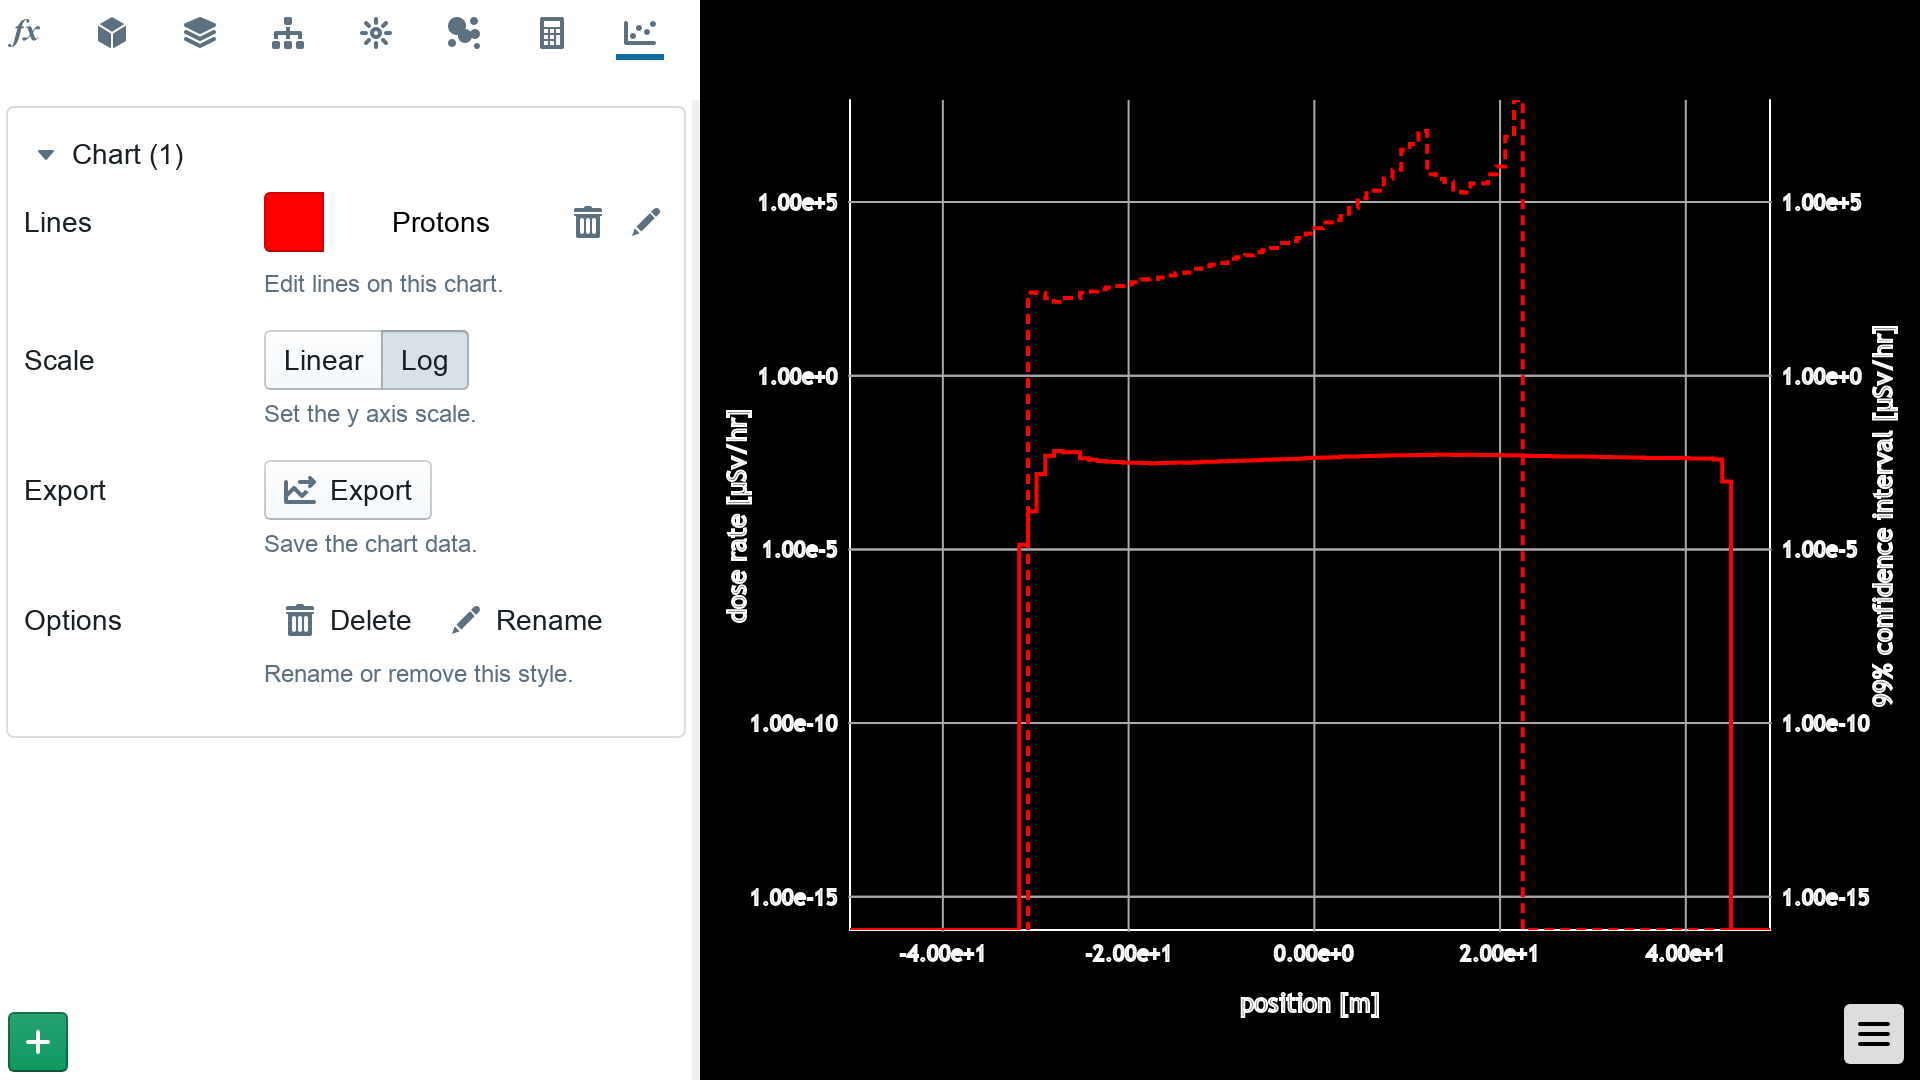
Use the charts tab to view and plot your dose data. It is possible to explore and break down the data according to the source it originated from, the detector it was recorded in, as well as particle type, and simulation run.
